Sepia-toned heading image for Ruminati emissions reporting.

Your farm’s emissions report,
ready for when a bank or buyer asks

Built from the records you already keep,
and it also gives you a read on how efficiently your farm runs.

Farm Data Code certified logo

Farm Data Code certified

Ruminati is certified to the Australian Farm Data Code, a National Farmers Federation certification you can check independently, so you know how your data’s handled.

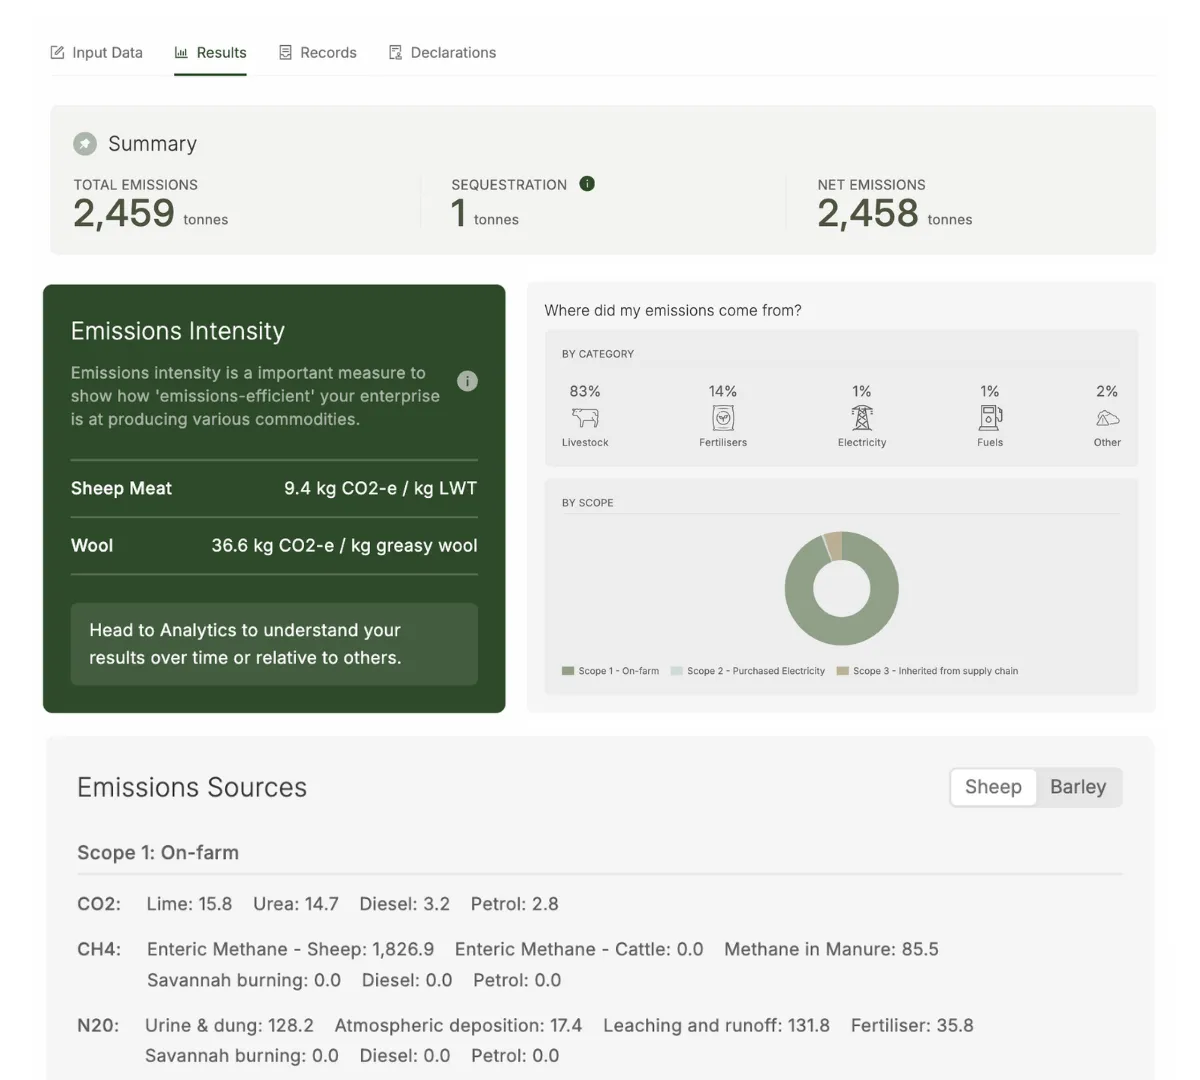
A screenshot of a Ruminati emissions report for a sheep farm showing emissions sources and scope 1, 2 and 3 emissions.
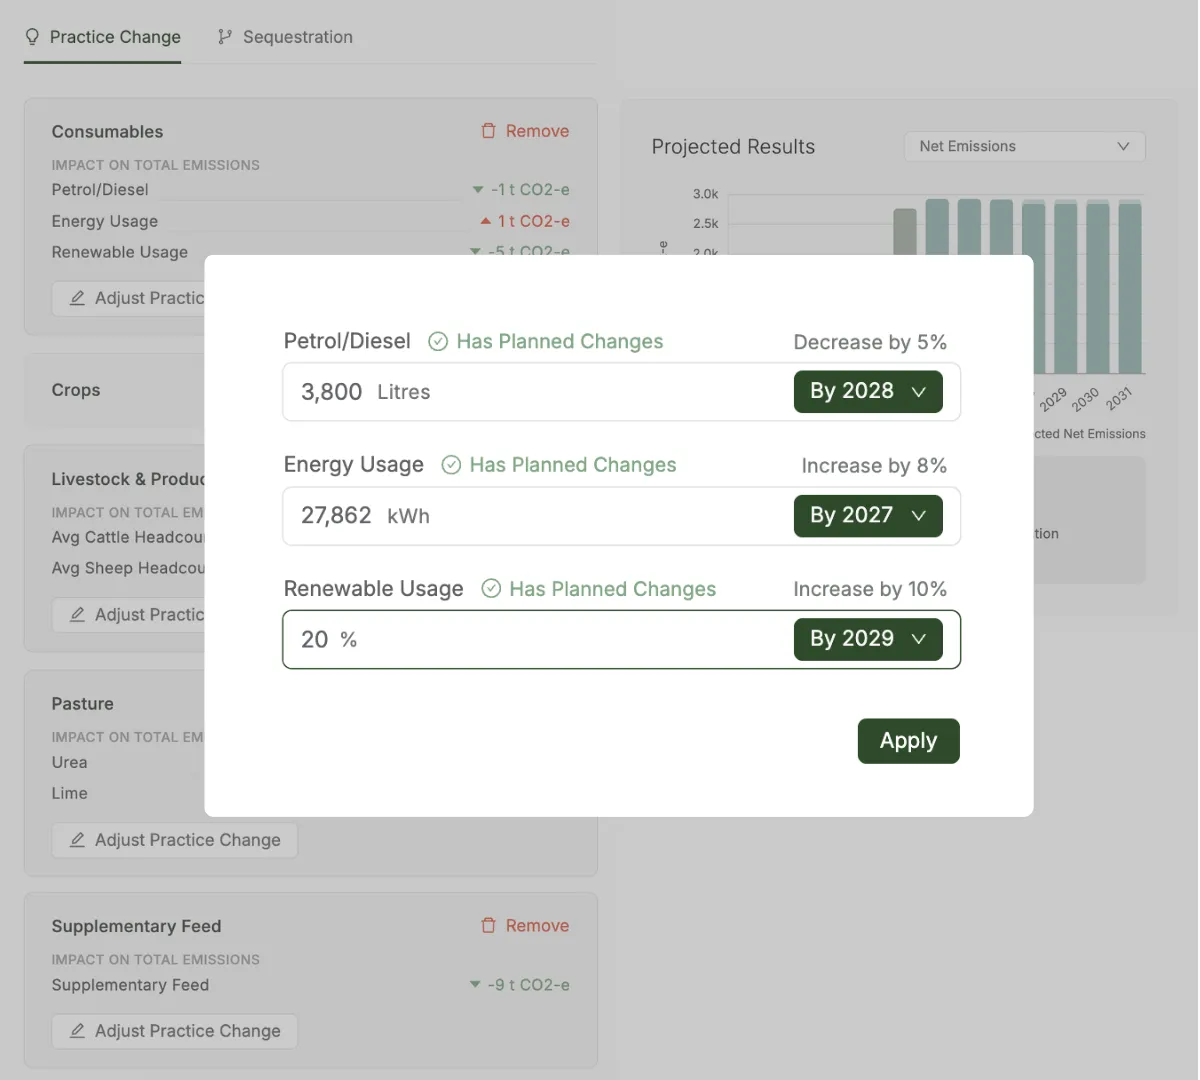
Screenshot of the Ruminati emissions planner showing how farmers can model their fuel usage and see the emissions impact.
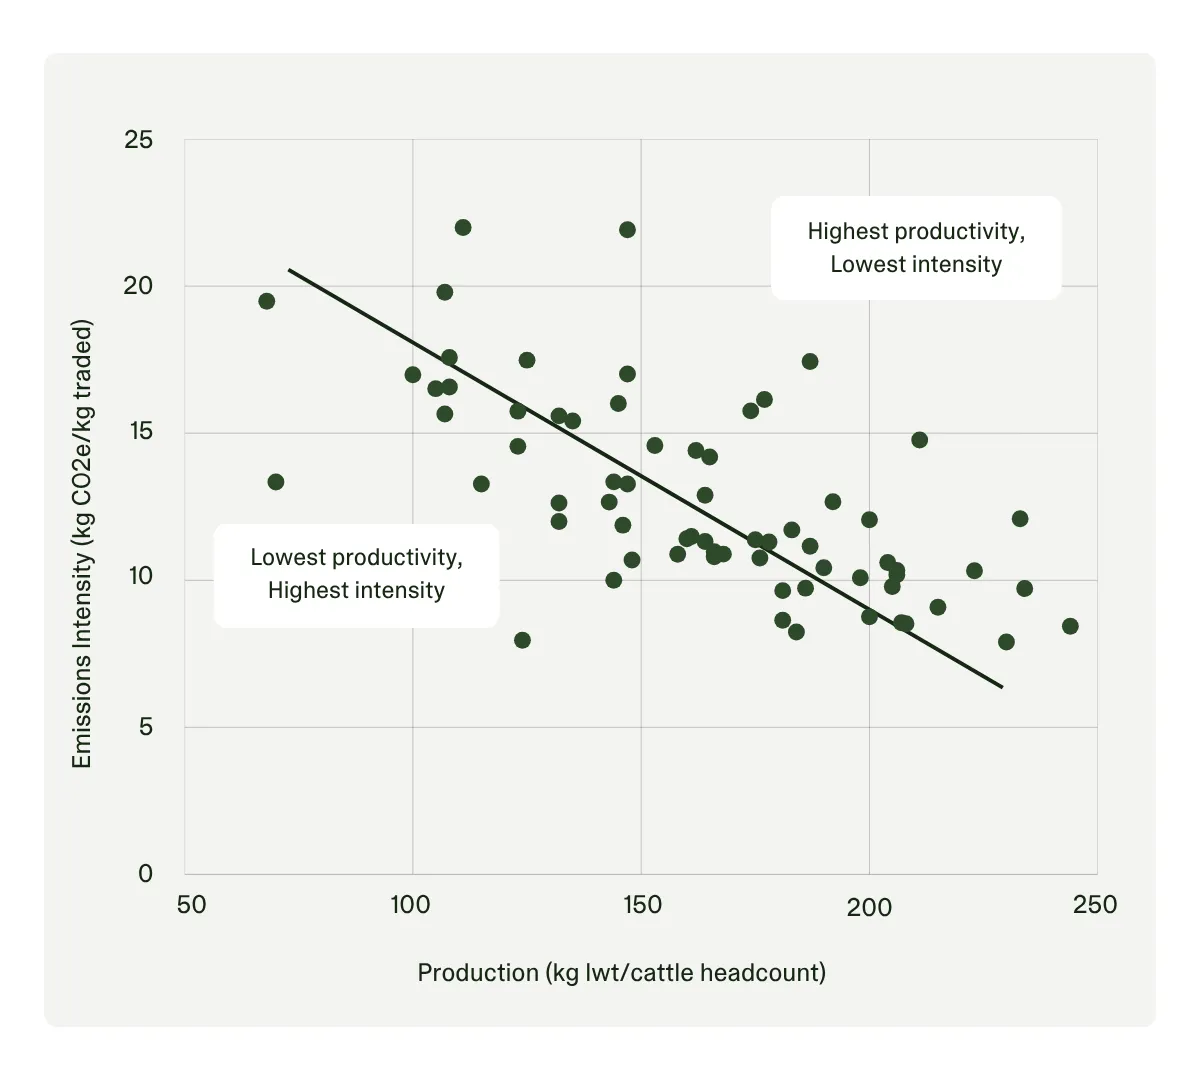
A graph demonstrating real data from a Ruminati project showing the relationship between emissions intensity and productivity for beef farmers.
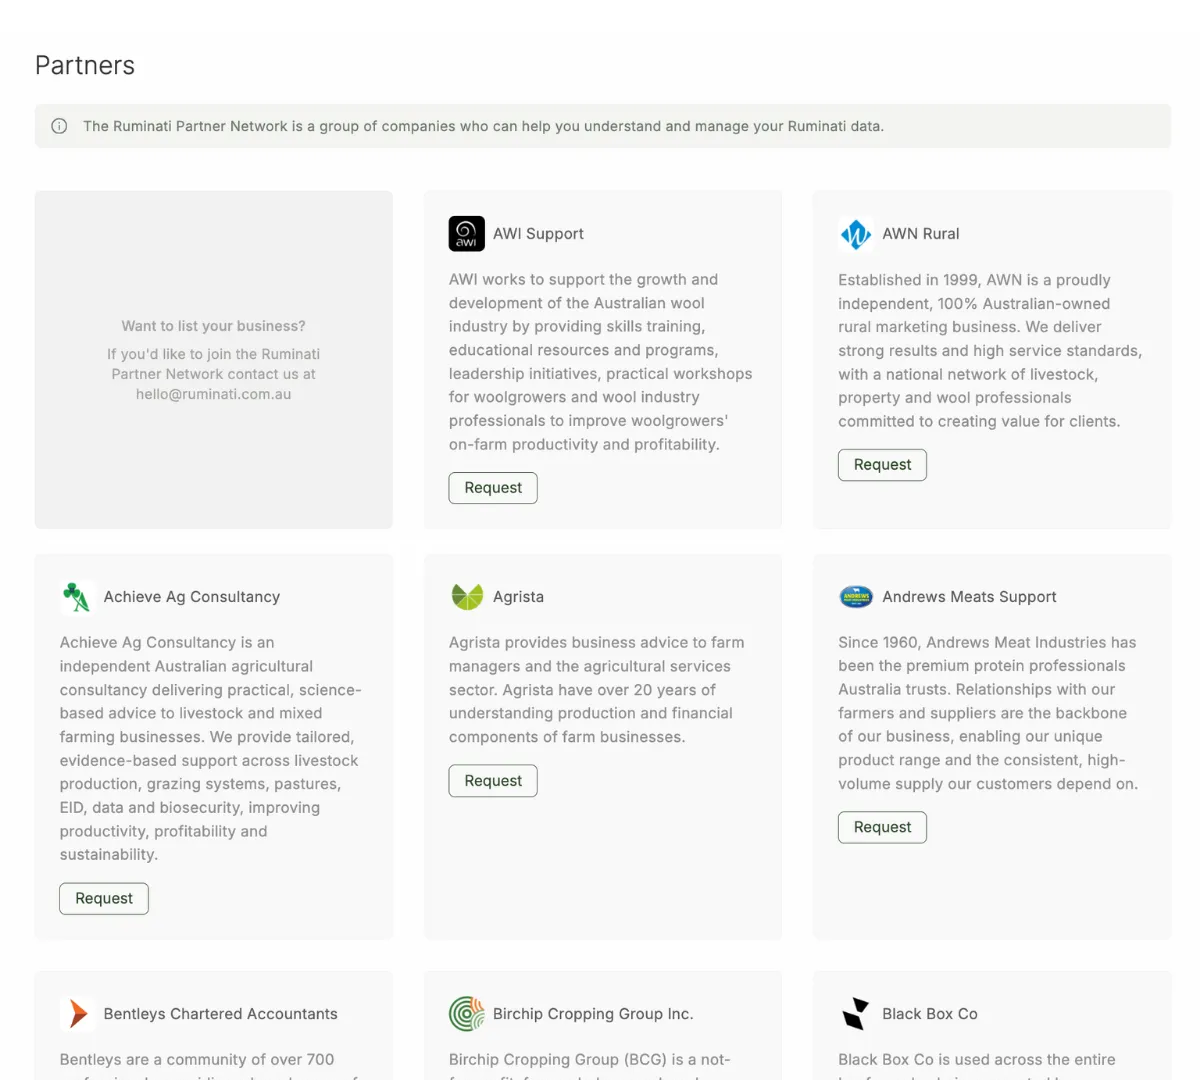
Screenshot showing some of the advisors on the Ruminati advisor directory including AWI, Agrista and Bentleys Chartered Accountants.
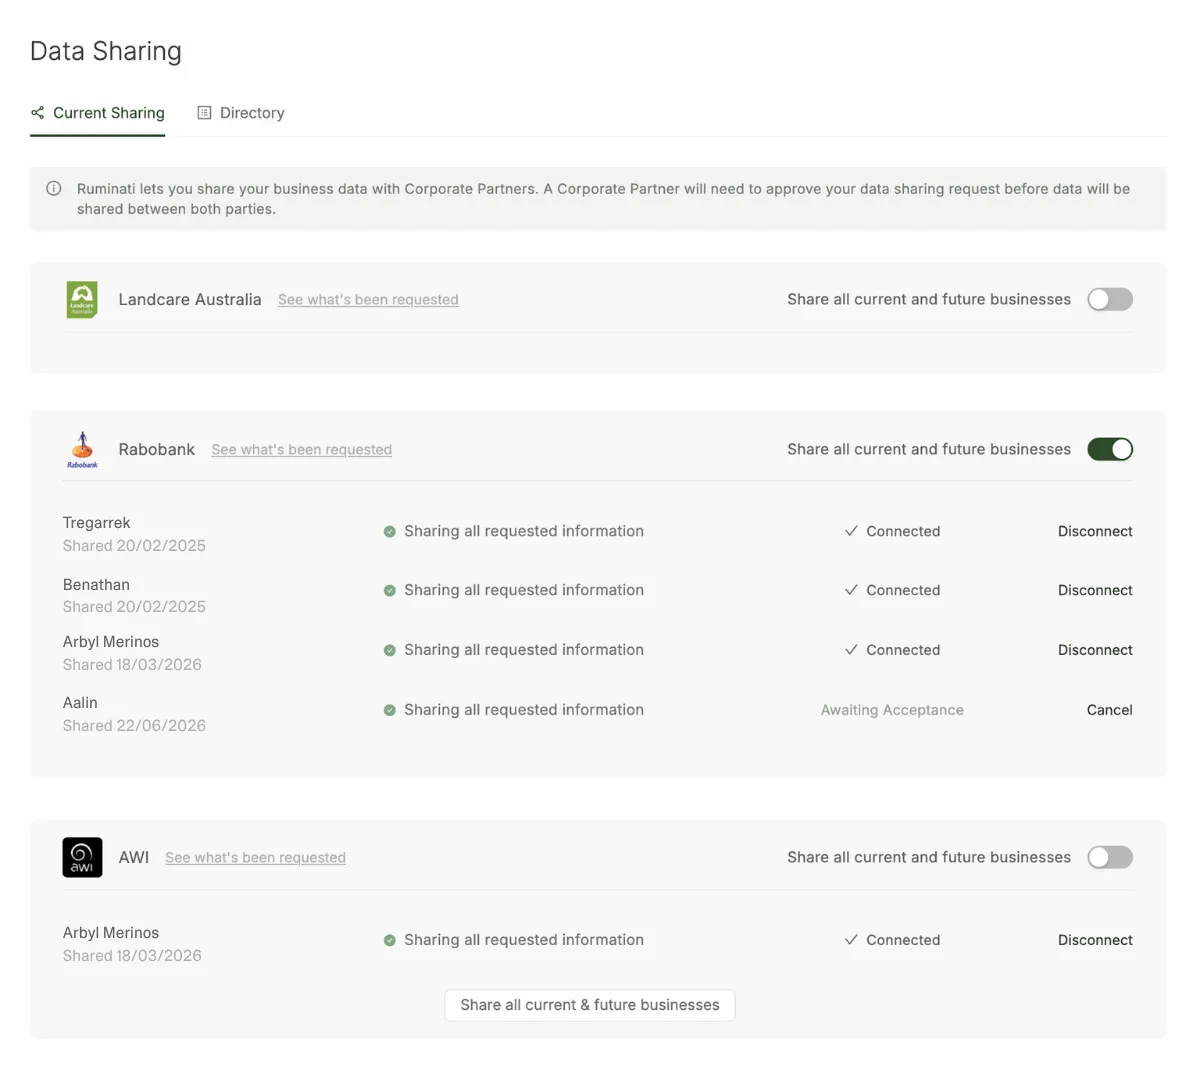
Screenshot of the Ruminati platform data sharing controls for farmers showing that farmers can see when and who they're sharing data with and how to cancel a data share.

Your farm’s emissions

We work out your farm’s gross and net emissions from the records you already keep, the figures a bank or buyer uses in their own reporting.
Plan ahead

Try a change to your stocking rate or inputs before you commit to it, and see what it does to your emissions.

A read on efficiency

Emissions intensity, the kilograms of emissions for every kilogram you sell, tracks with how efficiently the farm runs.

Let your advisor draft it

Your accountant, bookkeeper or agronomist can draft the report and work through it with you, and you sign it off.

You decide who sees it

When a bank or buyer asks for your report, you choose whether to share it, and you can turn access off at any time.
Reporting builds over time


First report

  • A line in the sand to work from
  • Something to give your bank or buyer
  • Shows where your emissions come from

Second report

  • Something to measure against
  • Shows what changed since your first report
  • An early read on a practice change

Every report after

  • Puts any one season’s swing in context
  • A trend you can show a bank or buyer
  • Shows what’s moving your efficiency

Resources

Emissions demo video

Demo: emissions

Producer checklist for mixed farming

Producer checklist

Data sharing guide

Data sharing guide

Emissions 101 guide
Emissions 101

Create your own emissions report, free for you and your advisor.

Get started free