An emissions report comes with several figures on it, including gross emissions, net emissions and emissions intensity, and it is not always obvious which one matters for the farm itself. Gross and net emissions are the figures a buyer or bank is most likely to ask about, and emissions intensity is the one that says something about how the business is running, which makes it the figure most worth getting to know.
Ask most producers what they want from their operation and the answer comes back much the same, which is more production from the same inputs, or the same production from fewer inputs, since fewer inputs mean lower costs and more production means better returns. Emissions intensity follows almost exactly the same logic. It measures kilograms of CO₂ equivalent per kilogram of product, with total emissions divided by total production, so a business that produces more from a given set of inputs, through lower mortality and better reproductive rates as well as higher average daily gain, ends up with a lower figure, while one producing less from the same inputs ends up with a higher one.
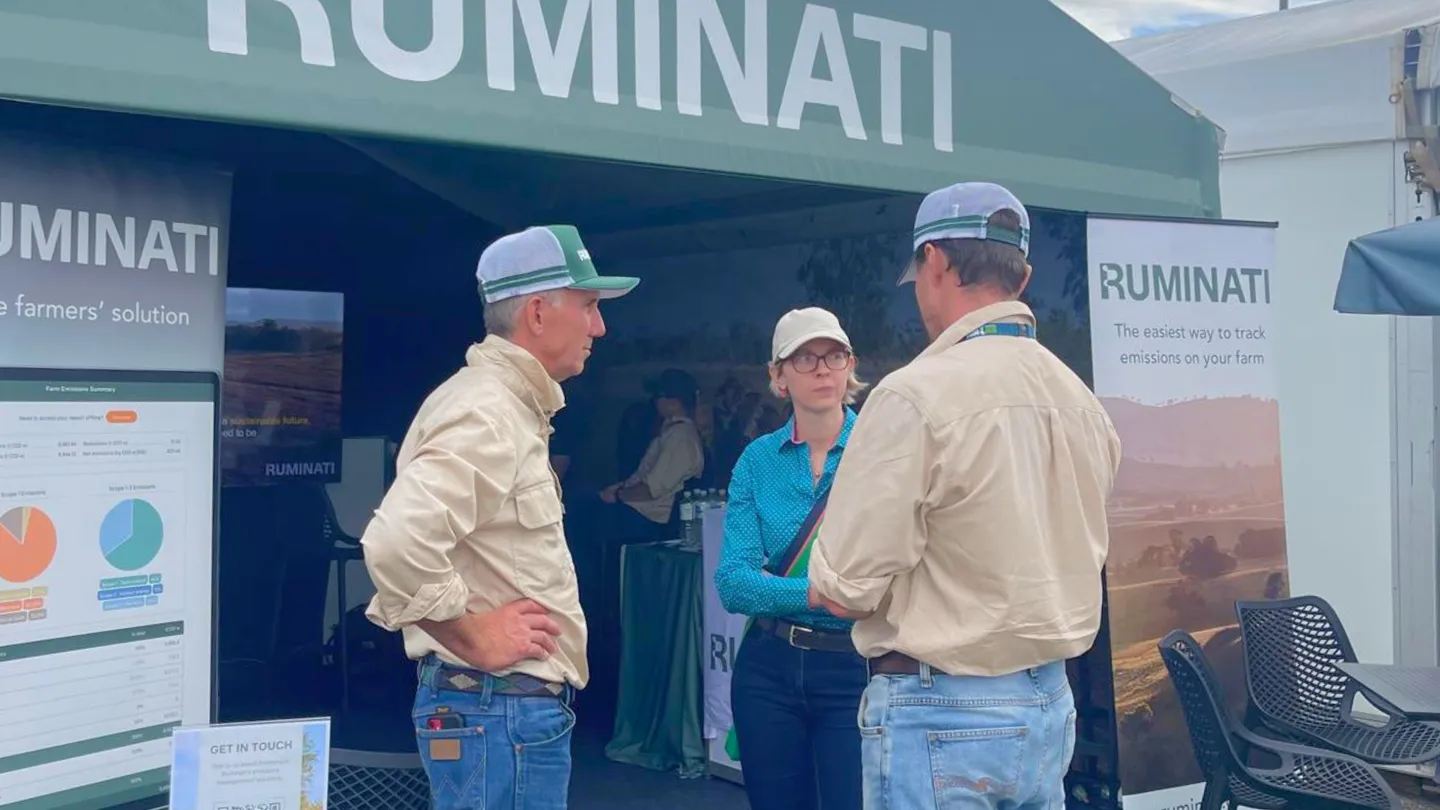
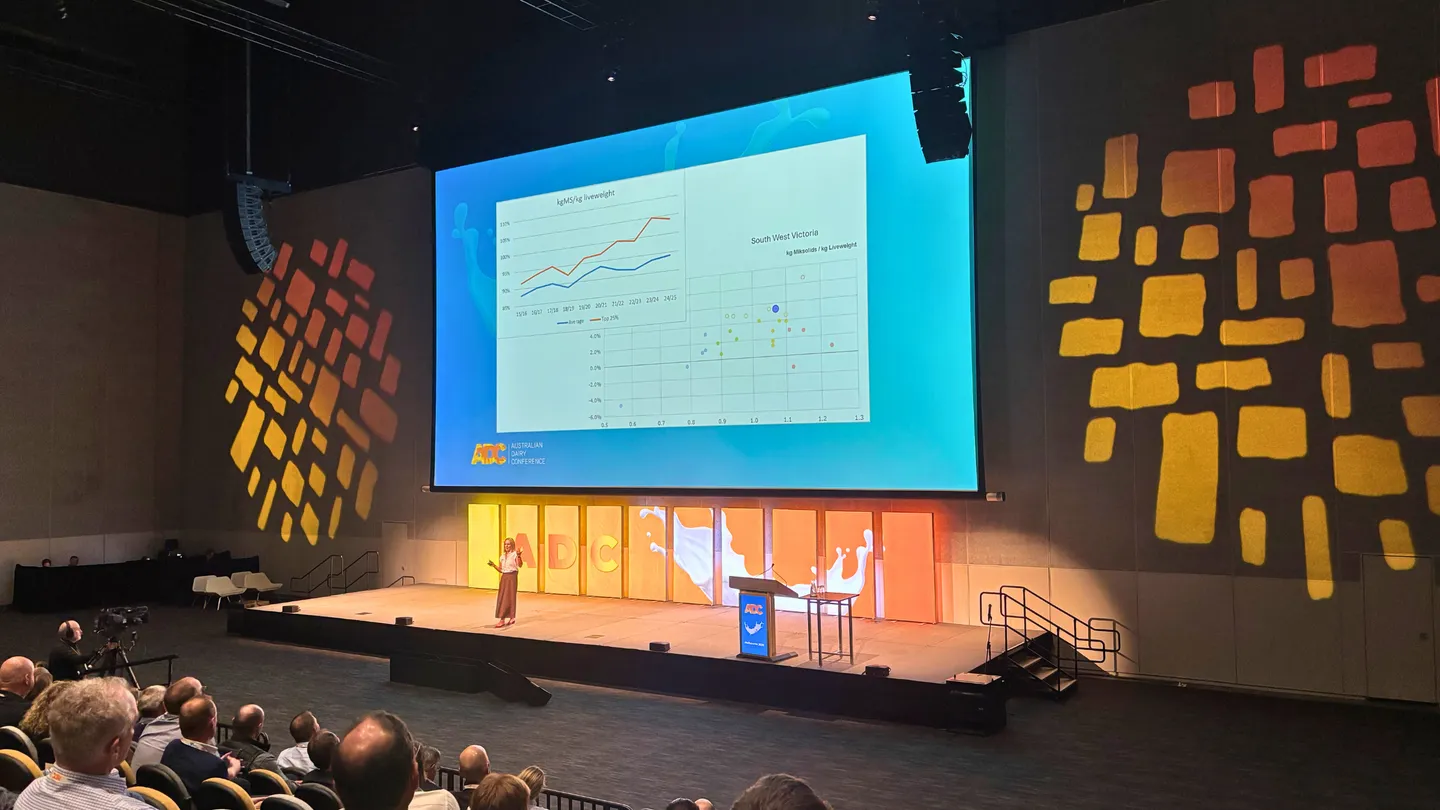
Looking across the users on Ruminati’s platform, that relationship shows up clearly. The top 5% of producers for productivity sit around 30% below the national average for emissions intensity, and the most efficient businesses are consistently the lowest emitters per kilogram of product. That is a pattern across the platform, and each producer’s records stay their own.
For reference, the national average for beef across breeding, growing and finishing sits at 12.6 kg CO₂e per kilogram of liveweight, and for sheep meat it is 6 to 10 kg CO₂e per kilogram. Seeing where an operation sits against those averages is useful context, though the more telling read is how the farm’s own figure moves from one year to the next, because that follows the decisions made on the property.
Those decisions are the ones producers already weigh up for profitability, such as improving reproductive rates and reducing inputs, along with managing stocking rates against seasonal conditions, and all of them show up in the intensity figure. One thing to keep in mind is that total emissions can hold steady or rise while intensity falls, because the production side of the ratio grows, which is why the two are read separately.
For producers already working to run an efficient operation, the emissions conversation is closer to home than it first looks, because the intensity figure responds to the same management decisions that improve profitability. Getting it down on paper puts it where the farm can see it.