Banks and supply chains are starting to ask farms for emissions figures, and of everything on an emissions report, emissions intensity is the figure that says something about how the business is running. It divides total emissions by total production, in kilograms of CO₂ equivalent for each kilogram of product, so a farm that produces more from the same inputs ends up with a lower figure, and it moves with the same decisions you already weigh for profitability, such as reproductive rates and stocking rates against seasonal conditions.
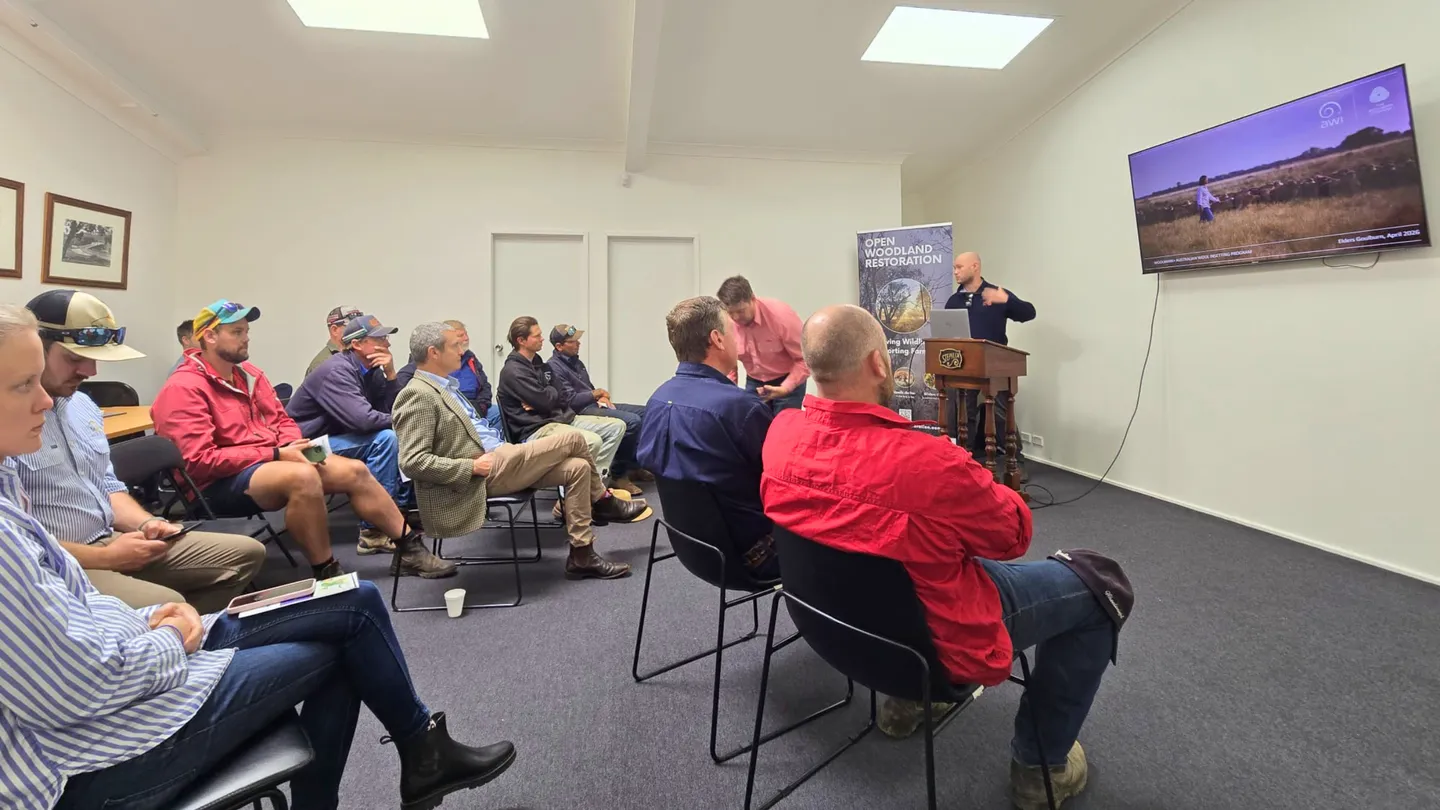
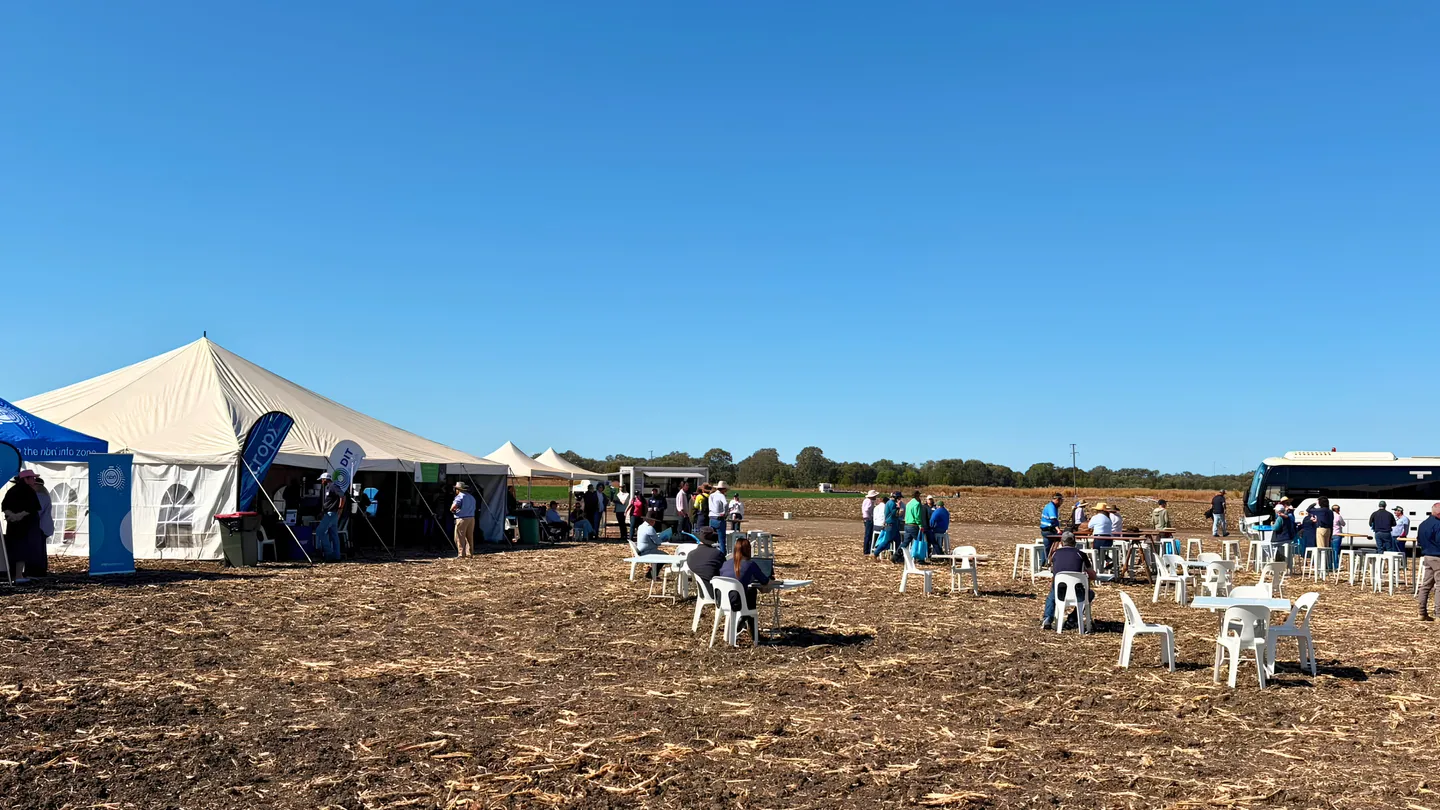
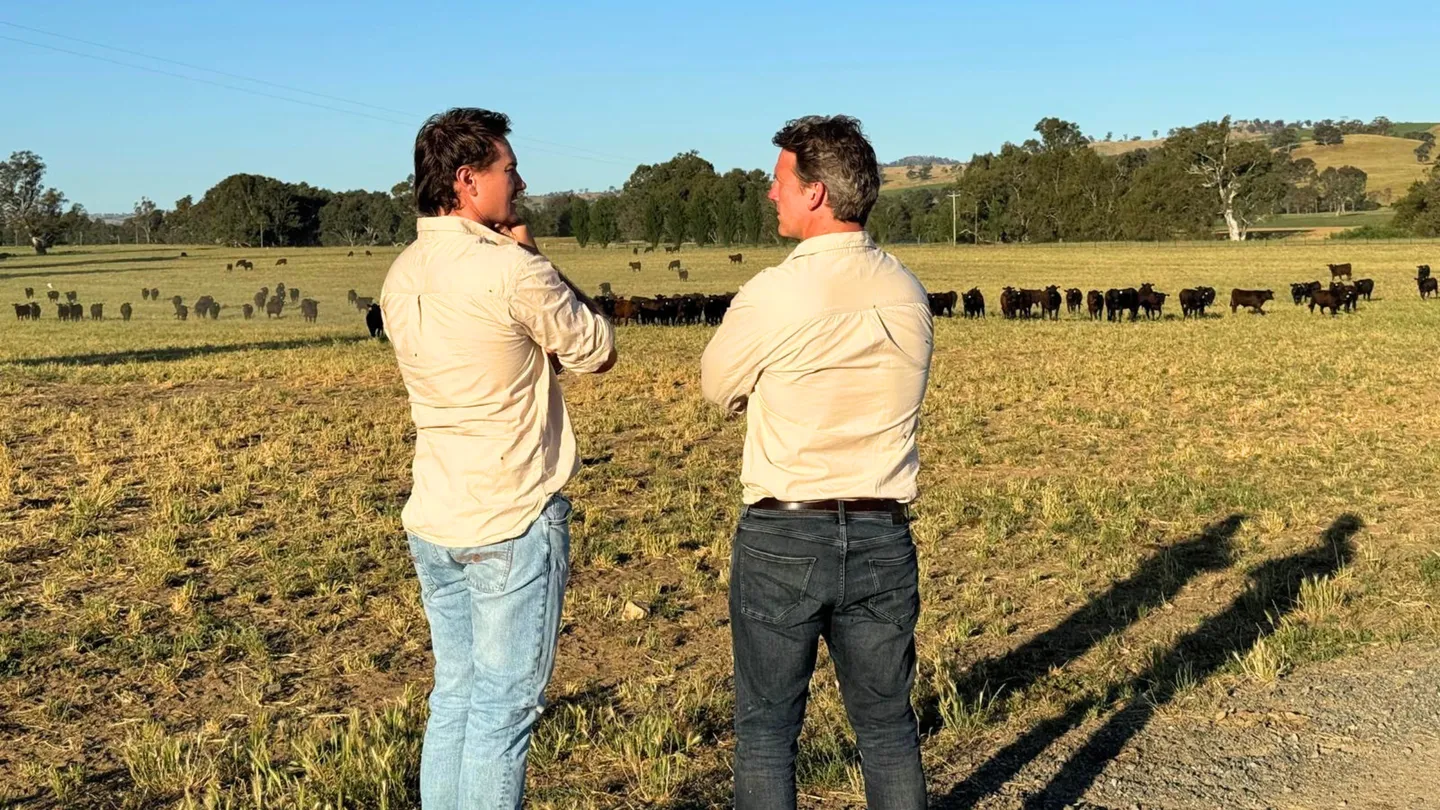
A question about that figure opened a longer discussion at a workshop with the Chinchilla Landcare Group, run in partnership with Landcare Agriculture and organised by Ang Hammond. The workshop grew out of a conversation at the National Landcare Conference between Will Onus, a Ruminati co-founder and now COO, and Terry Elliott, who runs an organic grazing operation out of Chinchilla, about what emissions reporting means on the ground.
The group began with what emissions reporting is and why banks and supply chains are starting to ask for it, and with whether it can work for producers or is another compliance burden dressed up in new language. Emissions intensity then raised three further questions, and each one comes back to reading the figure against your own farm.
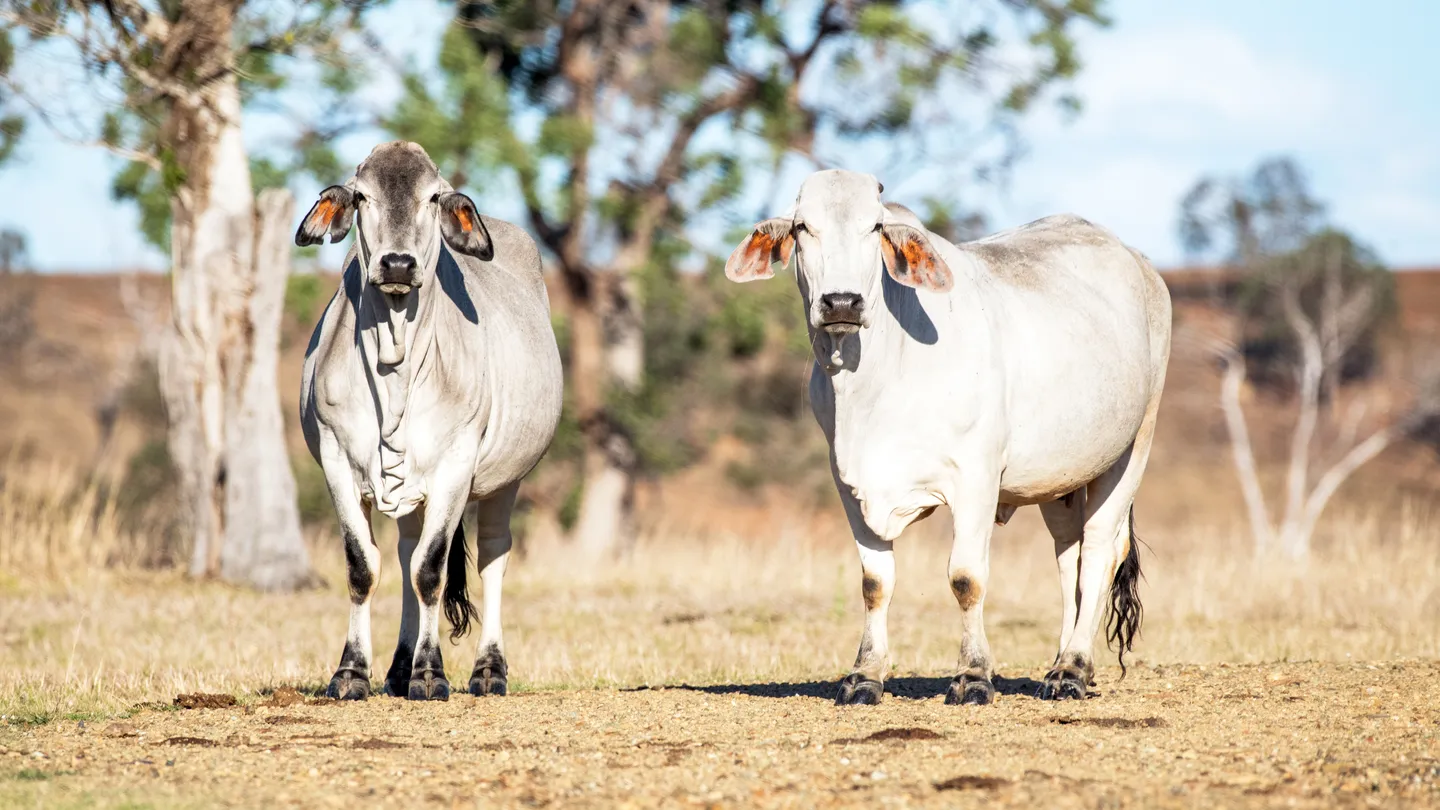
The first was whether a grazing operation in the Riverina should be measured against the same national average as one in Chinchilla, given how differently climate and country shape each production system. The calculation already allows for the difference. Cattle on lush pasture in cooler, wetter areas are eating feed that is easier to digest and produce less methane per head, while cattle on dry, arid ground work through coarser, more fibrous feed and produce more. The factor behind your livestock emissions reflects the pasture and climate your herd lives on in place of one average for everyone. The national average is useful context, and the more telling read is how your own figure moves from one year to the next, since that follows the decisions made on your property.
Reading your own years also answers the second question, which was what happens when a hard season pushes the figure the wrong way for reasons outside your control. A drought year with stock numbers cut right back and a good year with the paddocks fully stocked will give very different results, and the difference reflects the change in circumstances. With one year of records you have no way to show that context, while with four years you can show the swings between years and the trend underneath them. Terry Elliott said, “One of the surprising and pleasing things is that this just wasn’t that hard.”
The third came from producers running lean, low-input systems, who asked whether there is a point where doing the right thing early works against you. We can’t promise an answer that holds for every system and every buyer, and Ruminati applies the standards that others set in place of setting them, so we would sooner say so than offer a tidy one. What a lean system holds is its record, and a record that shows where you started and where the farm is heading puts you in a different conversation with a bank or buyer than a single snapshot does, since they are increasingly interested in trajectory alongside a point-in-time figure. How they would read a farm that was already lean when it started counting is a fair question to put to them before you hand anything over, and who sees your figures stays your decision.